Santa got his weekly gift-wrapping report from the Gift Wrapping department. It contained lots of numbers
1 3 7 8 5 3 2 1 3Every number corresponded to the gifts wrapped by every elf in the department in alphabetical order, starting with Alabaster Snowball, and continuing with Bushy Evergreen. But numbers don’t sing, and that made Santa not sing either. A simple way to check visually what was going on was needed.
Simple, text charts
The Unix philosophy is doing one thing, and doing it well. Small utilities, with just a few lines of code and no dependencies, are easy to build upon, understand, modify, whatever.
They are also good to learn a language. Text::Chart was created six years ago almost to the day, also slightly one year after Raku, then called Perl 6, was officially born with its Christmas release. I didn’t know too much about the thing, and even less about how to release a module, but I tried and do it anyway. Essentially, it’s a single function:
Uses a default block character to build the bars that compose the chart, and then defines a function that takes a maximum value (arbitrarily set by default to 10), a set of chars to build the bars, and then a couple of nested loops (which originally even used loop) that, line by line and starting from the top, build the chart. There’s no high magic, nothing fancy. And many errors, some of them I only discovered when I was writing this article.
To help and use it directly, a command line script is installed along with the module
Santa builds himself a chart
Using the downloaded module, Santa types:
raku-text-chart 1 3 7 8 5 3 2 1 3Obtaining:

Hey, not perfect, but at least it’s clear by how much the fourth elf, Shinny Upatree, outwraps the others in the bunch.
However, this reminded him of something. What if…?
We can’t help but use a leftpad, right? And mightily useful here. We get this:
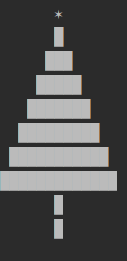
Not as nice as the magic tree, but as useful as my friend Tom Browder post to wish y’all a merry Christmas!

3 thoughts on “Day 20 – Create beautiful text charts”