
Although I love using Raku, the fact that it is still a relatively young language means that there is a fair amount that is lacking when it comes to tooling, etc. Until recently, this included a way to calculate code coverage: how much of the code in a library is exercised (=covered) by that library’s test suite.
Now, truth be told, this feature has been available for some time in the Comma IDE. But this (together with other arguably essential developer tools like profiling, etc) is only available in the “Complete” edition, which requires a paid subscription.
Still, I knew that the Raku compiler kept track of covered lines, so I always felt like this should be doable. It only needed someone to actually do it… and it looks like someone actually did.
So, consider my surprise when, while recently browsing raku.land, I came across App::RaCoCo, which claims to be ‘a Raku Code Coverage tool’. Sweet!
Let’s see how it works.
Running locally
The library ships with a racoco executable, which is what we’ll use to calculate the coverage. The first couple of times I ran it I got some scary output because it could not find the library to test, but after reading the documentation, and trying a couple of things out, I managed to find a right set of options for me.
Let’s see it in action on my very own HTTP::Tiny:
$ racoco --exec='prove6 -l' --html
t/agent.t ......... ok
t/errors.t ........ ok
t/mirror.t ........ ok
t/online-async.t .. skipped
t/online-basic.t .. skipped
t/requests.t ...... ok
t/responses.t ..... ok
t/url-parsing.t ... ok
All tests successful.
Files=8, Tests=52,  9 wallclock secs
Result: PASS
Visualisation: file:///home/user/HTTP-Tiny/.racoco/report.html
Coverage: 81%
Success! We can run our test suite, with the development version, and we get a nice little summary at the bottom. Thanks to the --html option we even generated an HTML report we can examine in the browser, with line-by-line details on what was covered.
The tool is still young, and there are still quirks that should be ironed out. I’d expect the friction with the --exec flag to be one of those. But until then, we have a working tool we can use. Huzzah!
So we can run the tool locally, which is great. But can we run it on code that is hosted remotely? And how do we publish those results?
With a lot of my distributions, what I’ll do is send coverage output to Coveralls, which keeps track of it and renders it publicly, which is great.
However, racoco does not ship with a Coveralls exporter, and currently has no way to plug in custom reporters (like, say, the cover tool used in Perl). This feature is in development, but until then, we’ll need an alternative.
Running on GitLab
Since most of my Raku distributions are hosted on GitLab, that’s what I’ll be demonstrating, but a lot of these steps are likely the same or similar in other popular CI platforms.
The CI configuration I’ll be using will look something like this:
# In your .gitlab-ci.yml
coverage:
  image: rakuland/raku:latest
  before_script:
    - zef install --/test --deps-only --test-depends .
    - zef install --/test App::RaCoCo
  script:
    - racoco --exec='prove6 -Ilib' --html
    - mv .racoco public
    - find public -type f -not -name "*.html" -delete
  artifacts:
    paths:
      - public
    public: true
This defines a “coverage” job which will run in an environment where we install the dependencies of the library we are testing, as well as the App::RaCoCo distribution itself. We then use racoco to generate the report, and we make sure all the HTML files from the report are in the public directory, which we can then expose as a public artifact.
This means we can then view these in the browser via a link like this one.
But we can go one step further. Even though we cannot (yet) easily talk to external tools like Coveralls, we can still make use of the Gitlab features to put this link in a badge that nicely displays our coverage percentage.
For that, we’ll have to set a coverage parsing regex, which Gitlab will use to parse the coverage percentage from the CI job output. In this case, to work with the racoco output, we can use Coverage: \d+.\d+%.
The value that is parsed will then be available as a badge that can be set in the “General” project settings.
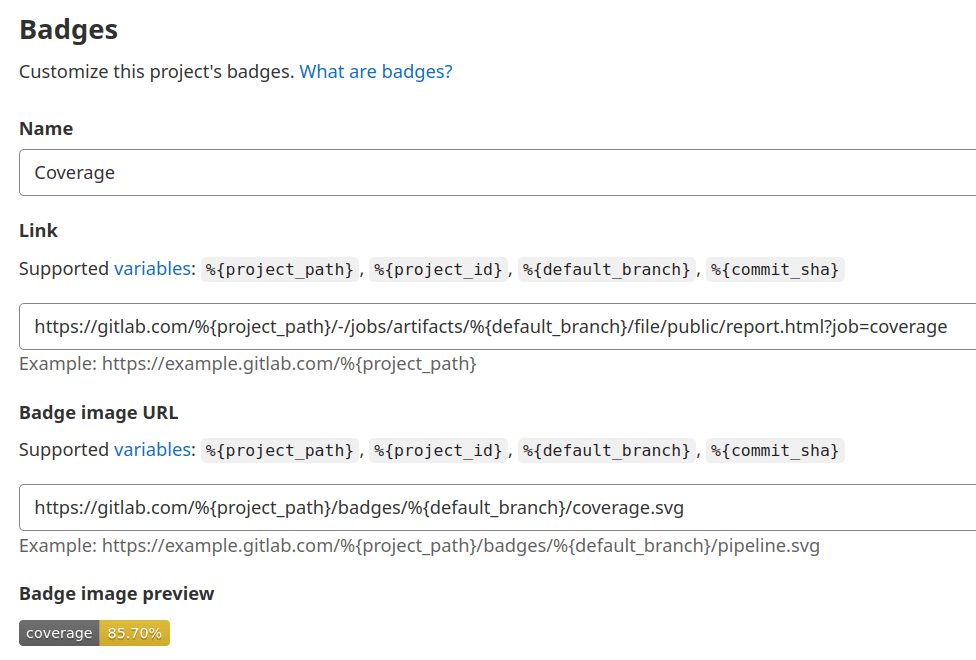
The fields in that section take placeholders, which means that these values should work for whatever project we are configuring. We can use this one for the path to the coverage badge:
https://gitlab.com/%{project_path}/badges/%{default_branch}/coverage.svgAnd this one if we want to link to the published artifacts of the latest coverage job (do note that in this case we are referring to the job by name, so if you’ve used a different name you’ll have to update it):
https://gitlab.com/%{project_path}/-/jobs/artifacts/%{default_branch}/file/public/report.html?job=coverageIf all went well, the badge will display in the main page of your project as shown in the image at the top of this post. This will happen automatically (=you don’t have to manually add them to the readme, for example), and any badges you add will link to wherever you pointed them to.
Room to grow
As noted above, racoco is still young and there are are still some rough edges. One in particular is that running the tool multiple times on the same test suite will sometimes generate slightly different results, and that some lines might either not be picked up as coverable or covered, even though they are. Some of this is due to this being a new tool, and some of it is due to the way Rakudo reports this data in the first place. In either case, these should be issues we can fix.
Despite the rough edges, the tool has already proved useful to me, and it’s become a part of my regular setup.
The future is bright, and there’s room to grow.

It’s very nice to wake up in the morning, open a fresh advent and see that your work has been useful. Thanks a lot for the post!
LikeLiked by 3 people
Just checked, @atroxaper released App::Racoco::Report::ReporterCoveralls and we can export reports to coveralls.io! Perfect.
LikeLike
https://github.com/atroxaper/raku-RaCoCo-Reporter-Coveralls
LikeLike
@pheix Many thanks! 🙂
LikeLike