1. The profiler you will use
Raku has a nice visual profiler.
No excuse to ignore it, it is extremely simple to use.
Just run the profiler with raku --profile=myprofile.html foo.raku then open the generated HTML file in your favorite browser (for instance firefox myprofile.html &).
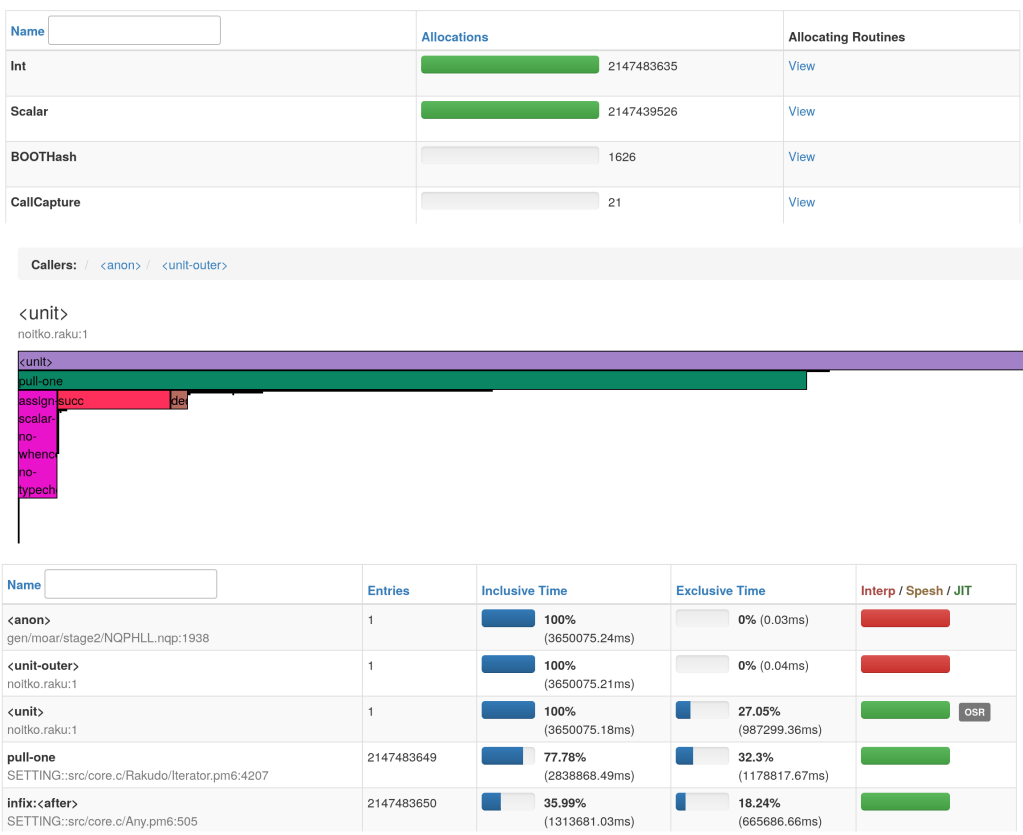
This is an overview of what you can have in the profiling report :
Even better, you can use Moarperf with SQL profiles : use raku --profile=myprofile.sql foo.raku and after raku -I . services.p6 myprofile.sql
“SQL profile” is an output format of profiles that is compatible with moarperf.
Below is an overview of one of the panels of MoarPerf :
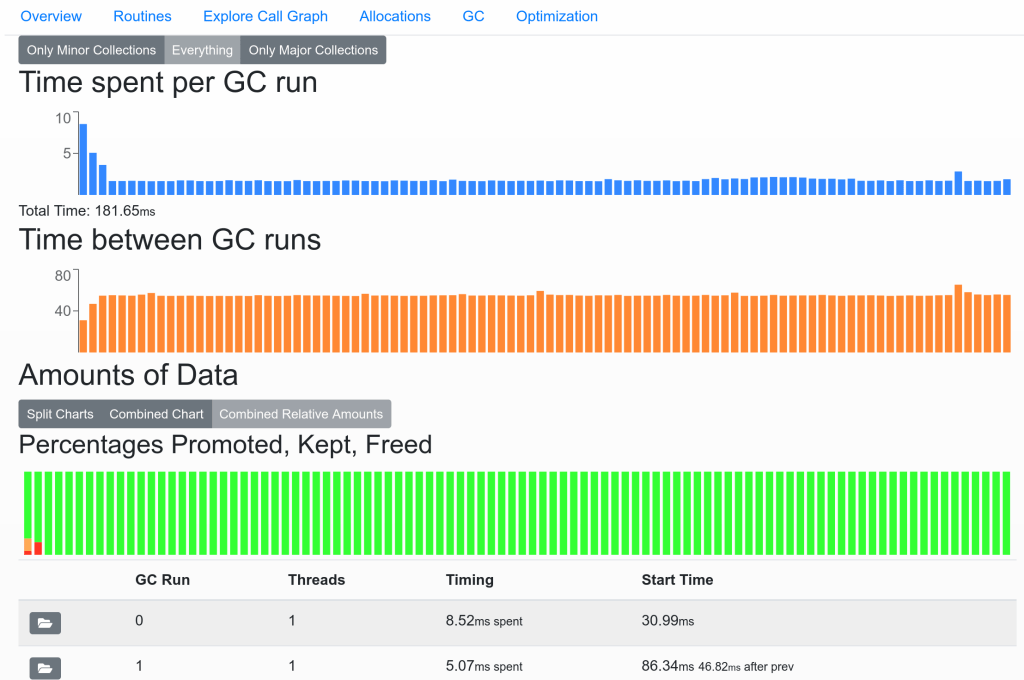
“GC” refers to Garbage Collection which is an internal mechanism of the virtual machine when it comes to cleaning/unfragmenting memory.
You can check if some runs are very long, if the runs are too frequent and finally the way the “cells” are managed (the items have a “lifetime” called “generational garbage collection” where items move from one space to another and change their “state”)
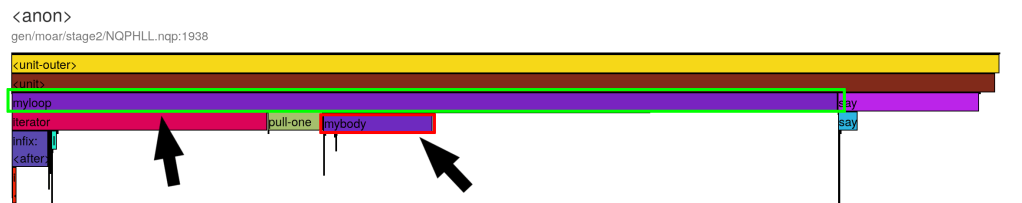
If you want to have more info in the call graph, do not use named loops (MYLOOP: won’t help) but use subs !
sub myloop() {
    ...
    ...
}
Like this working example:
my $result = 42;

sub mybody($i) {
    if $i % 2 {
        $result += 2;
    }
}

sub myloop() {
    USELESS: for (0..1000) -> $i {
        mybody($i);
    }
}

myloop();
say $result;
The “sub trick” will produce some overhead (call stack) but can help you investigate.
2. Native type you will venerate
It’s written everywhere, in BIG LETTERS, use native types for performances ! 😀
This is true, it gives you blazing fast Raku scripts ! (but you have to be rigorous)
To convince you, start with implicit types :
my @a = ();
for (1..10_000_000) -> $item {
    @a.push($item);
}
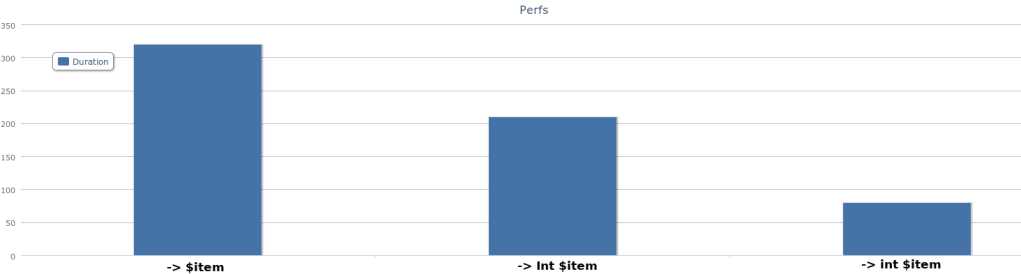
That is slow :
# real 0m11.073s
# user 0m10.614s
# sys  0m0.520s
Then change to native type of the item we want to push :
my @a = ();
for (1..10_000_000) -> int $item {
    @a.push($item);
}
It is slightly better, but still bad because only the item is declared as a native int:
# real 0m9.007s
# user 0m8.469s
# sys  0m0.600s
Finally the “full” native int version (container + item) :
my int @a = ();
for (1..10_000_000) -> int $item {
    @a.push($item);
}
That performs very very well :
# real 0m0.489s
# user 0m0.454s
# sys  0m0.105s
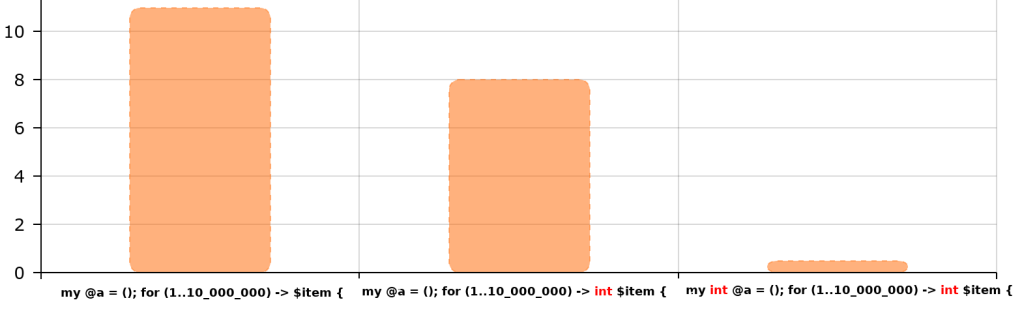
(y-axis are seconds taken from time reports, I used amcharts to draw the graphs)
On the allocations side, this is what happen :
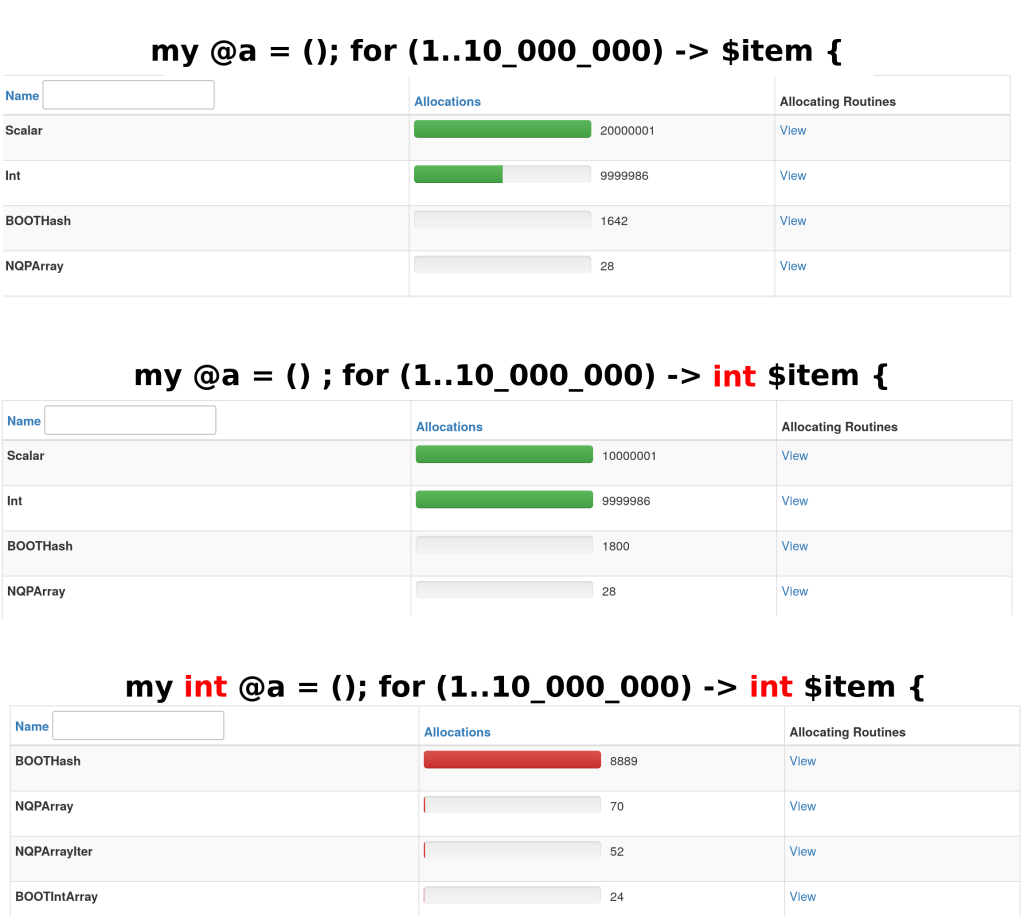
If you wonder what is BOOTHash, it is a lower-level hash class used in some internals for instance to pass arguments to methods.
To know what produced the BOOTHash allocations (SPOILER: @a.push($item)), you can click on View :

3. In the power of spesh (and JIT) you will believe
Spesh and JIT are MoarVM optimizations.
Spesh is more like trying to translate methods/attributes… to cheaper versions.
JIT means Just-In-Time compilation. It is used by MoarVM to compile “hot” code to binary (not bytecode).
The apparently simple loop :
for (1..1_000_000_000) -> $item {
Runs fast with default opts :
# real 0m6.818s
# user 0m6.843s
# sys  0m0.024s
Runs a bit slower without JIT (MVM_JIT_DISABLE=1) :
# real 0m22.555s
# user 0m22.562s
# sys  0m0.028s
Runs A LOT slower without JIT nor spesh (MVM_JIT_DISABLE=1, MVM_SPESH_DISABLE=1, MVM_SPESH_INLINE_DISABLE=1, MVM_SPESH_OSR_DISABLE=1) :
# real 5m21.953s
# user 5m21.434s
# sys  0m0.164s

What happens under the hood ?

Notice that call frame each time moved to a different optimization category.
4. In optimizations you will trust (again)
This time we play with empty loops, this is important to notice.
Look a these 3 different sorts of loop iterator declaration :
No type at all
for (1..1_000_000_000) -> $item { }
No iterator or Int declared
for (1..1_000_000_000) { }
# Or
for (1..1_000_000_000) -> Int $item { }
Native type iterator
for (1..1_000_000_000) -> int $item { }
Each are allocating different objects (sometimes Int or even sometimes nothing at all).
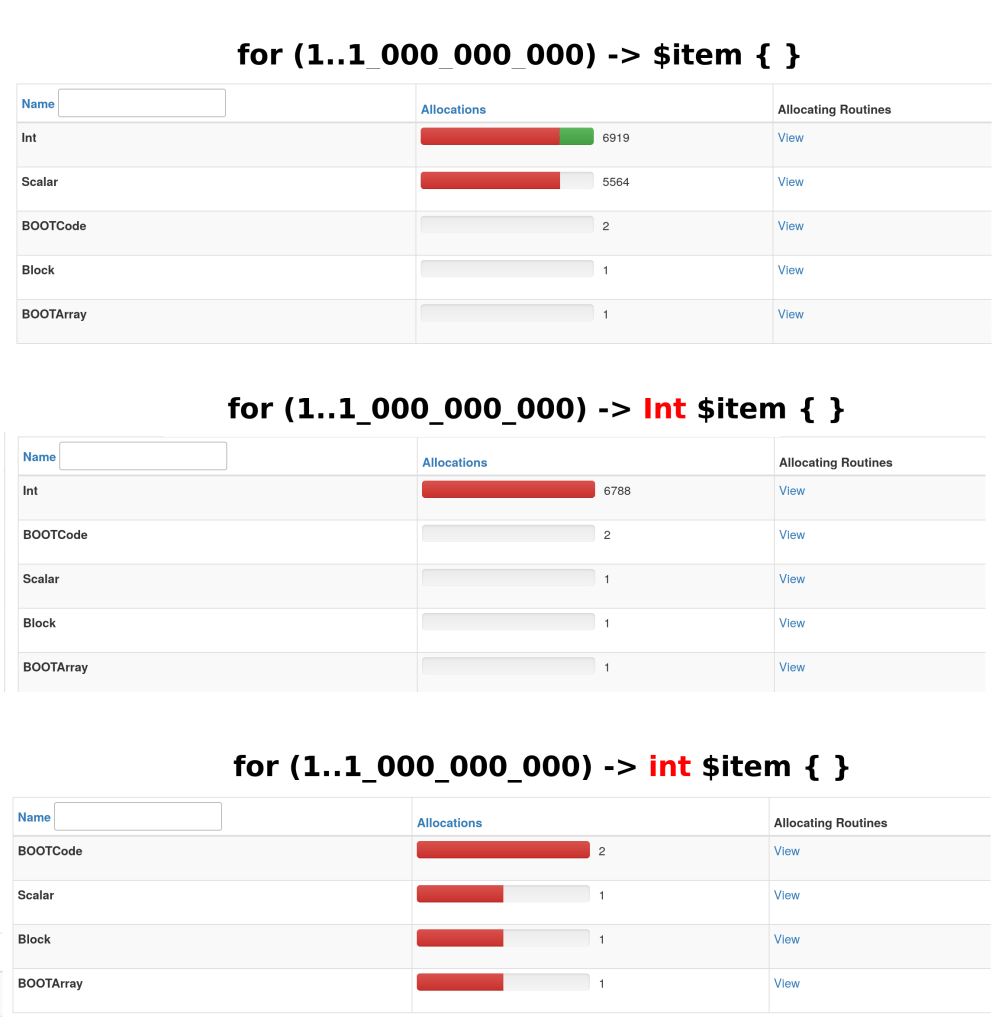
As you can see, the number of allocations is not the actual number of loop iterations, the optimizer has done a good job.
Remember it’s an empty loop, if you use $item in the body then the allocations number will increase a lot !
This is why (empty loop + optims), with optimizations enabled, they surprisingly all perform the same.
But when optimizations are disabled, it is another story 🙂
No explicit type (for (1..1_000_000_000) -> $item { }) :
# real 5m1.962s
# user 5m1.592s
# sys  0m0.152s
Explicit Int object type (for (1..1_000_000_000) -> Int $item { }) :
# real 3m32.763s
# user 3m32.647s
# sys  0m0.076s
Native int (for (1..1_000_000_000) -> int $item { }) :
# real 2m18.874s
# user 2m18.787s
# sys  0m0.037s
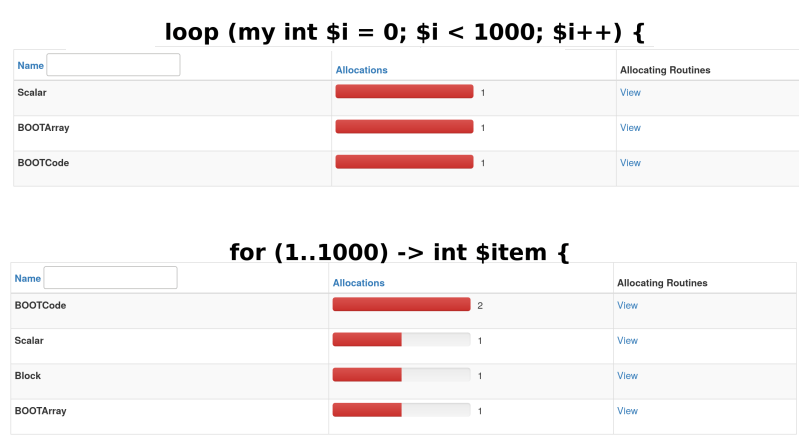
5. All kinds of loops you will cherish* the same way
*or hate, it depends
Basic loop ?
loop (my int $i = 0; $i < 1000; $i++) { }
Or foreach with a range (there is maybe some allocs here ?) ?
for (1..1000) -> int $item { }
Choose what you prefer, they do not do the same but seems to perform almost the same ! 😀
6. From some bad builtins you will hide
With native types, raku performs very well, even better than several competitors.
But on the other hand, some builtins just perform bad than others. It is the case with unshift.
my int @a = ();
for (1..16_000_000) -> int $item {
    @a.unshift($item);
}
unshift gets bad performances relatively quickly.
#    500 000
# real 0m0.197s
# user 0m0.218s
# sys  0m0.037s

#  1 000 000
# real 0m0.209s
# user 0m0.223s
# sys  0m0.040s

#  2 000 000
# real 0m0.400s
# user 0m0.436s
# sys  0m0.036s

#  4 000 000
# real 0m1.076s
# user 0m1.087s
# sys  0m0.053s

#  8 000 000
# real 0m3.712s
# user 0m3.697s
# sys  0m0.072s

# 16 000 000
# real 0m14.544s
# user 0m14.430s
# sys  0m0.192s
If we look at push in comparison…
my int @a = ();
for (1..4_000_000) -> int $item {
    @a.push($item);
}

#   500 000
# real 0m0.216s
# user 0m0.258s
# sys  0m0.021s

#  1 000 000
# real 0m0.209s
# user 0m0.231s
# sys  0m0.032s

#  2 000 000
# real 0m0.224s
# user 0m0.223s
# sys  0m0.057s

#  4 000 000
# real 0m0.249s
# user 0m0.259s
# sys  0m0.045s

#  8 000 000
# real 0m0.410s
# user 0m0.360s
# sys  0m0.108s

# 16 000 000
# real 0m0.616s
# user 0m0.596s
# sys  0m0.108s
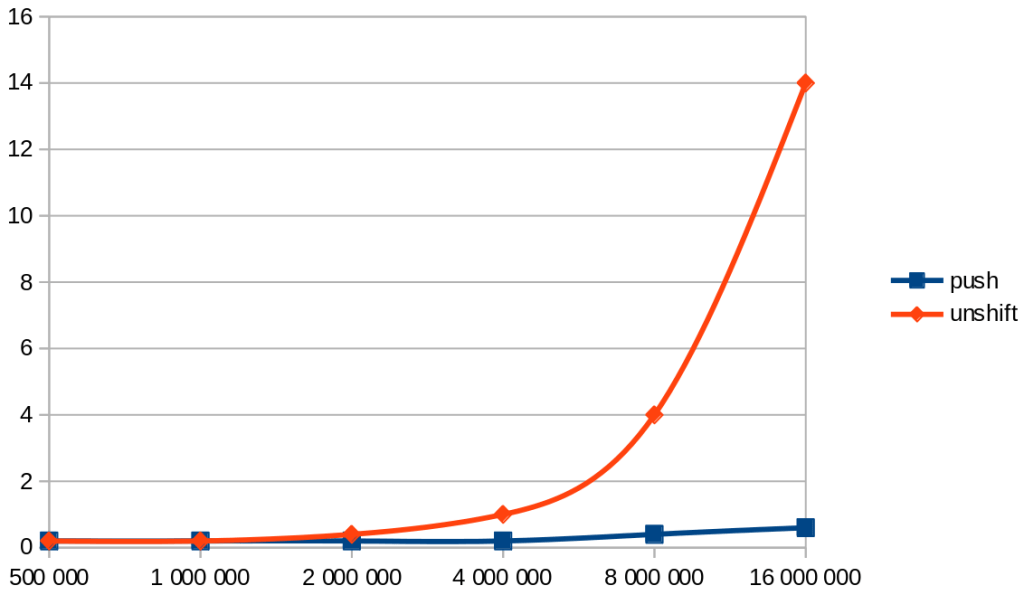
The overall idea is “prefer good performers builtins”
unshift perfs were even worse until very recently, but it’s not very fair to mention it since these terrible performances were not something “normal” but a bug in MoarVM that I reported and that was quickly fixed since then (thank you !!).
Another example is everything that is related to regex.
This first code is very slow because of ~~ :
my $n = 123;
my $count = 0;

for (1..10_000_000) {
    if $^item ~~ /^$n/ {
        $count++;
    }
}

# real 1m12.583s
# user 1m12.189s
# sys  0m0.064s
Simply replacing ~~ per starts-with drastically improves performances :
my $n = 123;
my $count = 0;
for (1..10_000_000) {
    if $^item.starts-with($n) {
        $count++;
    }
}

# real 0m3.440s
# user 0m3.470s
# sys  0m0.044s
This last idea was stolen from this cool presentation 🙂
7. MoarVM over JVM you will prefer
The reference code
for (1..10000000) -> Int $item { }
running in Rakudo + MoarVM :
# real 0m0.388s
# user 0m0.287s
# sys  0m0.047s
versus Rakudo + JVM :
# real 0m21.290s
# user 0m32.255s
# sys  0m0.588s
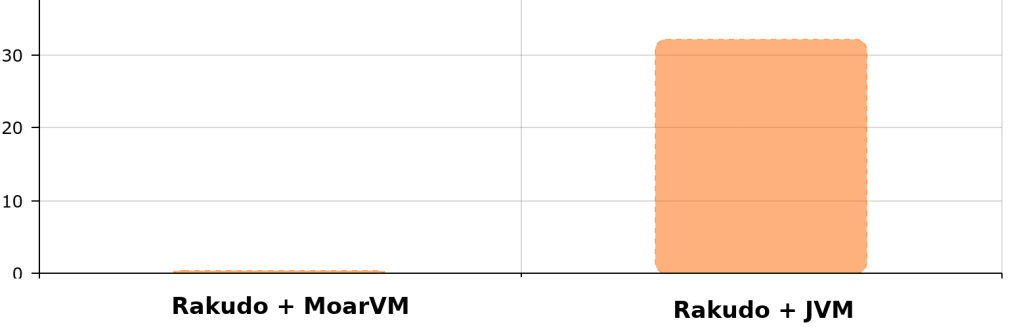
Extra good reasons to not use JVM :
- JVM support is incomplete (from rakudo news)
- JVM startup time is much much longer
8. With big integers you will not deal
We have performance penalties for big numbers.
for (1..2147483646) { }
# real 0m15.421s
# user 0m15.429s
# sys  0m0.040s
To compare with
for (1..2147483647) { }
#                ^
# real 17m1.909s
# user 16m59.627s
# sys  0m0.396s
It is especially highlighted with this code sample (huge penalty for very small leap) ![]()
Again, this particular example is not fair (I reported an issue about it), but you get the idea that dealing with big int (even native types) won’t cost the same than dealing with small int…
9. Better algorithms you will always search
VM, compiler, optimizations… Nothing can help with bad code logic !
Stay far from costly builtins or greedy allocation algorithms and think that everything inside a loop is important to optimize.
10. Heisenberg effect you should never forget
Sadly, profiling could make change the :
- behaviour of your execution
- duration of your execution (sometimes making it 10 times slower…)
Having threads can also confuse the profiler (reporting up to 90% spent in garbage collection…). This is the kind of typical issue that you can have for instance if you try to install and use Unix signals to interrupt a running profiling session.
Conclusion
Raku with its profiler is a very cool playground for performance optimizations 🙂
According to me, in 2020, there are still some areas to improve (optims) but native types already allow you to get often much better performances than competitors, and that is very nice.

These are all great tips!
I’d add one more, that’s much more basic but that tripped me up when I was new to Raku: put your code in a module. Modules are precompiled, while scripts never are. Thus, there is an entire class of optimizations that will never happen for code in a script but that happen automatically for a module (even if code remains exactly the same and is called from a one-line file that does nothing else).
LikeLike